AIA Course: #BE2022C
Earn: 1 AIA LU/HSW; 1 IIBEC CEH; 0.1 IACET CEU
To complete the quiz and receive a certificate of completion, follow this link: ce.buildingenclosureonline.com/BE2022C
Sponsored by:
Learning Objectives:
After reading this article, you should be able to:
- Define Very Severe Hail (VSH), and its financial and geographic implications.
- Understand the severity of hail damage to roofs and the implication on occupancy and operations.
- Recognize the basic configurations of approved assemblies.
- Compare and contrast the effects of different VSH options and review design strategies.

First things first. If you don’t practice in or own a building in hail alley or a building insured by FM Global, why would you need to read this article?
- Roofs are the first line of defense against severe weather events, including hail.
- The geographic footprint of hailstorms has expanded and about two-thirds of the United States experiences 1 inch or larger hailstones, increasing insurance claims to $16.5 billion in 2020.
- While FM requirements only apply to FM insured buildings, the potential for damage applies to all buildings. It is not uncommon for owners and designers that do not insure buildings through FM to elect to follow FMs guidelines to protect their investments and mitigate their design risk.
And if you do practice in or own a building in hail alley, how will you know which Very Severe Hail (VSH) rated assembly to select out of the 16,500+ approved assemblies?
NOAA reports a significant increase in hail events over the past decade, averaging over 5,300 events annually. Hail-related insured losses between 2000 and 2019 averaged between $8 billion to $14 billion a year, according to Aon.3 There were 4,611 major hail events in 2020; 3,763 major hail events in 2021; and already 3,203 in 2022 as of June 30 2022, according to the NOAA’s Severe Storms database. Despite this large number of events, collectively they have fallen below the 10-year average.
During the winter, severe hailstorms are generally restricted to the Southeast. Most activity occurs in a band from east Texas to north Alabama. Meteorologically, this is a reflection of the relatively cool temperatures across the continent, the general lack of moisture in the air anywhere but along the coast of the Gulf of Mexico, and the low sun angle that limits the area of insolation sufficient for thunderstorm development. In April, the sun angle and length of daytime heating increases and moisture returns northward due to the strengthening of the Bermuda High. This, in concert with northward migration of the jet stream, shifts the maximum hail area to Oklahoma and the Red River Valley.
Continued northward progression shifts the July maximum to the Plains from eastern Colorado to northern Minnesota. There is also a weak summer maximum in smaller hail sizes over the desert southwest, indicating reports from hailstorms occurring with the North American monsoon. The northwestern states also have a small signal during this period, as extreme heating along the sloping terrain during the summer months helps to produce instability over this region leading to some severe hail producing storms. A small July area of enhanced hail activity is also located in Central Florida in the area where the Atlantic and Gulf of Mexico sea breezes often interact. Over the rest of the Southeast, except for along the Appalachians, hail activity during the summer is suppressed by the warm troposphere. In the autumn, the severe hail activity pattern is quite similar to the spring pattern. However, the occurrence rate is greatly diminished.
What in the Hail Does Very Severe Hail Mean?
When VSH requirements were introduced to the roofing industry, it was as if all hail was about to break loose! The issue was obvious. Buildings were being pelted with larger and more frequent hail storms. In 2018, insured losses from hailstorms topped $10 billion in the United States for the 11th year in a row.1 According to the National Center for Atmospheric Research, hail events account for 70 percent of the average annual property losses from severe convective storms in the United States.
How in the hail was the industry to respond to VSH? Before unpacking the impact of hail, and how the roofing industry has and is responding to the need to enhance the protection of buildings from the damaging effects of hail, let’s start with understanding it.
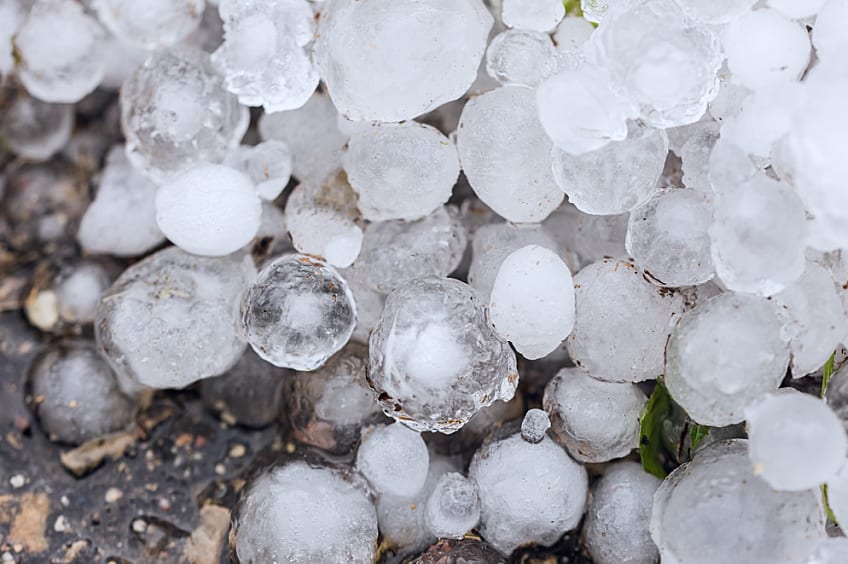
Hail is solid ice that forms when raindrops are carried upward by thunderstorm updrafts into the extremely cold atmosphere and freeze. Hailstones collide with liquid water that freezes onto the surface of the hailstone. Hail falls when the thunderstorm's updraft can no longer support the weight of the hailstone and is pulled toward the earth by gravity. The stronger the updraft, the larger the hailstone can grow.
According to National Oceanic and Atmospheric Administration’s National Severe Storms Laboratory (NOAA NSSL), VSH (2 inches in diameter or larger) forms in supercell thunderstorms as they have sustained updrafts that support large hail formation by repeatedly lifting the hailstones into the very cold air at the top of the thunderstorm cloud where they can accumulate more layers of ice.
NOAA produced a report on “The Frequency of Large Hail Over the Contiguous United States” back in 2003.2 This report notes that the annual average number of reported severe hail events jumped from about 1,100 in the late 1970s to almost 2,500 in the early 1980s. The area roughly correlated to “tornado alley” reported more than 600 severe hail reports per decade.
Number of hail events over the past decade. The past 2 years, the number of hail events have slipped below the 10 year average. Source: NOAA, graphed by Verisk.
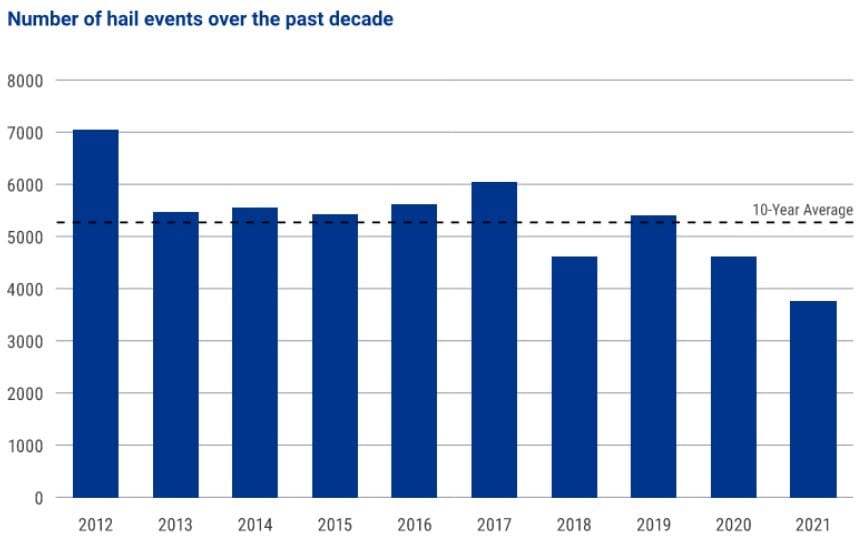
Figure 1
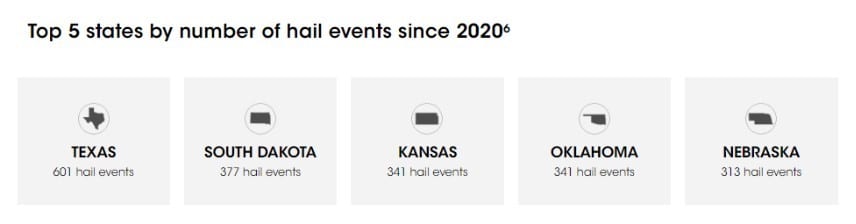
The Insurance Information Institute reports that Texas, South Dakota, Kansas, Oklahoma, and Nebraska have had the greatest number of hail events in the past two and a half years. These five states alone have experienced nearly 2,000 hail events in just a 2-year timeframe.
The top 5 states by the number of hail events since 2020. Source: Insurance Information Institute, Facts + Statistics: Hail, www.iii.org/fact-statistic/facts-statistics-hail
Figure 2
Despite the decrease in the number of hail events over the past few years, these events represented a wider geographic footprint and nearly 10 percent more U.S. properties were affected by hail in 2021 than in 2020. This was due, in part, to a growing number of hail events in the eastern United States, which is more densely populated than the traditional “hail alley” states.
According to Verisk’s 2021 report, “The Hail Hazard and Its Impact on Property Insurance,” 6.2 million properties in the United States experienced one or more damaging hail events in 2020, about a million fewer than in 2019. Nearly $14.2 billion in losses were reported in 2020.
With an estimated 1,591,074 properties, representing 17 percent of the state’s total properties, Texas has nearly 1 million more properties affected by hail than the next-highest state, Indiana. The total number of Texas properties affected by hail grew by 80,000 from 2020 to 2021. This accounted for nearly one quarter of all properties affected by hail events in 2021.
The estimated number of properties affected by one or more damaging hail events. Source: NOAA, graphed by Verisk.
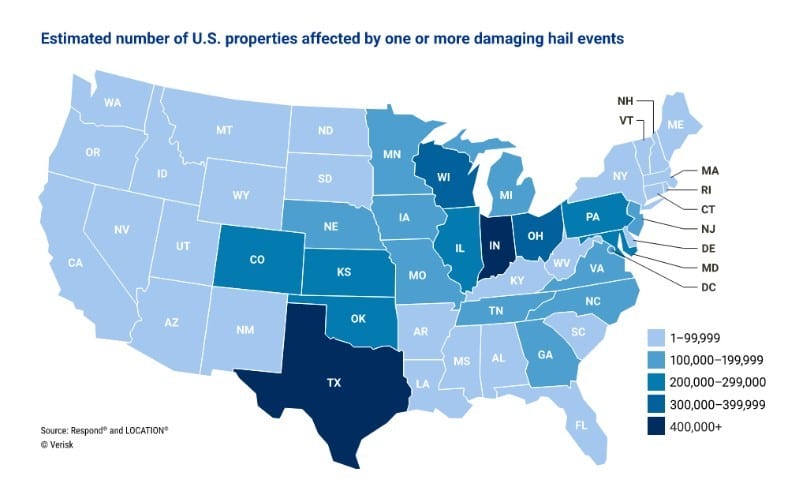
Figure 3
Coinciding with the increase in properties affected by a damaging hail event in 2021, there was also an increase in claims, which rose to $16.5 billion from $14.2 billion in 2020. Texas continued to lead with $5.1 billion in claims due to hail damage—nearly a $2 billion increase from $3.3 billion the previous year. Indiana, the second most-impacted state, had nearly an order of magnitude fewer claims than Texas, with $527,000 in claims from the 17 percent of its housing stock affected by hail.
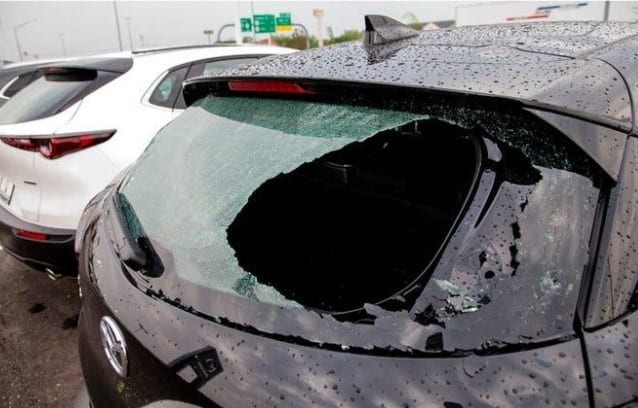
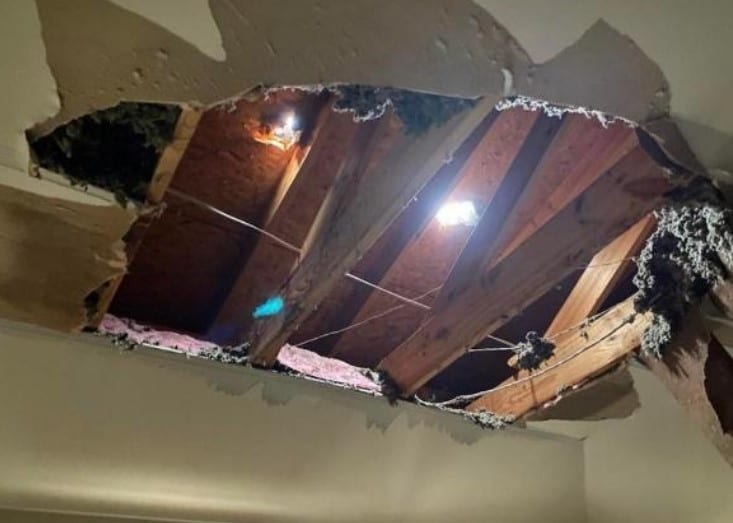
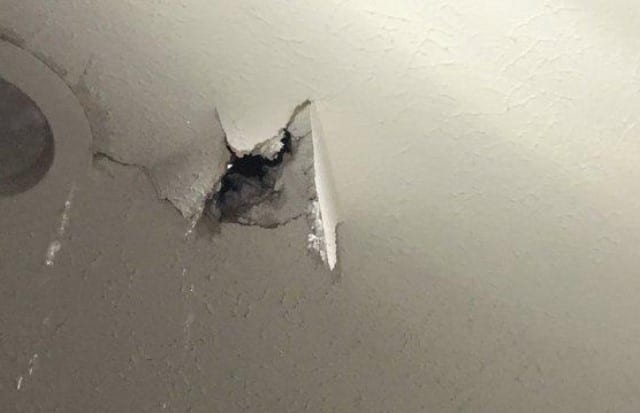
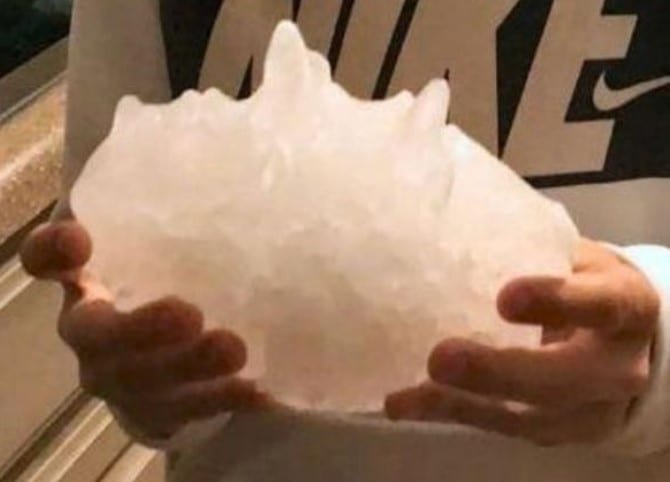
In 2021, more than 6.8 million properties in the United States were affected by one or more damaging hail events. Almost one quarter of the U.S. properties affected by hail were in Texas; over 1.5 million properties. Below are some images from damage resulting from a VSH event.
April 28th 2021 – Texas/Oklahoma hail event which produced the largest hailstone measured in Texas at 6.4 inches, the size of a honeydew melon. Images courtesy of USA Today, Reddit, Twitter, and the National Weather Service (from first to last).
Figure 4
According to data from Factory Mutual Insurance Company (FM Global), a leader in establishing best practices to protect buildings, the review of client losses between 2016-2020, showed that the average wind/hail losses averaged $931,000 per event. That’s a significant impact on a business, and it doesn’t account for the other longer-term effects that a disruptive loss could have; impacts on reputation, market share, and investor confidence, for example. This underscores why risk mitigation is so important given such impacts are unlikely to be covered by insurance policies.
VSH Designation
FM Global estimates their clients lose about $130M4 each year on average from hail events in the United States. Instances of severe hail storms are now widespread across the United States. About two-thirds of the U.S. experiences 1-inch or larger hailstones.Given the increasing volume of severe hail events and the resulting property loss, damage, and financial impacts, FM Global added to the requirements in the FM Loss Prevention Data Sheet (LPDS) 1-34 Hail Damage in 2018.
FM’s LPDS 1-34 identified the VSH region as encompassing Oklahoma, Kansas, Nebraska, South Dakota, most of Texas, and parts of Montana, North Dakota, Minnesota, Iowa, Missouri, Arkansas, Wyoming, Colorado, and New Mexico. Note that the top 5 states listed above with the highest number of hail events are the first 5 states listed in the VSH region.
FM’s LPDS 1-34 map outlining the different hail categories—moderate, severe and very severe. The Very Severe region is most commonly referred to as “Hail alley.”
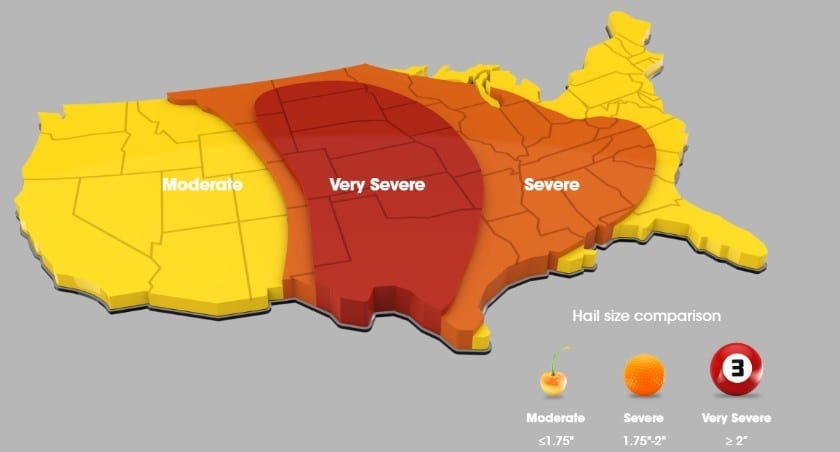
Figure 5
FM Approvals is a third-party testing and certification laboratory with a focus on testing products for property loss prevention using rigorous standards. FM Global, through the loss prevention data sheets, requires the use of FM Approved roof systems.
FM Approvals designed the hail tests for all regions with a 15 year mean recurrence interval. The Moderate Hail zone is based on an equivalent hail size of less than 1.75 inches; the Severe Hail zone is based on 1.75- to 2-inch size hail; and the Very Severe Hail zone is based on greater than or equal to 2-inch diameter sized hail.
Description of FM Approval hail regions.
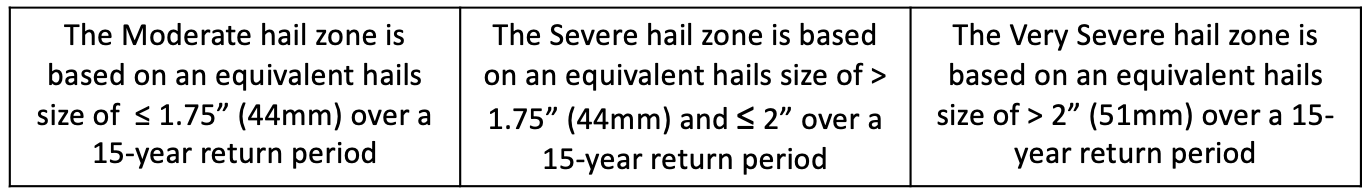
Figure 6
Roof systems seeking the VSH designation are tested on accelerated aged roof membranes that are subject to a more severe hail impact (higher impact energy). The test protocol evaluates damage to the roof membrane as well as the coverboard located beneath the membrane. VSH testing of roof systems is considerably more difficult to pass than the previous Severe Hail rating.
The VSH test follows ANSI FM 4470, which has requirements for single-ply, polymer-modified bitumen sheet, built-up roof (BUR) and liquid applied roof assemblies for use in Class 1 and noncombustible roof deck Construction,and includes launching a 2-inch diameter ice ball from a hail gun, propelled at 152 to 160 ft/s, resulting in an impact energy of 53 to 58 ft-lb tested on the roof system with three different conditioned roof membranes:
- An unaged sample
- A sample after 1,000 hours of UV weathering; and
- A sample after 1,000 hours of UV weathering and 1,000 hours of heat aging